
Methodology
MIPAS-B is flown under huge balloons with a volume of up to 400.000 cubic meters at float. These balloons (operated by CNES) carry the payload up to altitudes of about 40 km (Zobs).
The infrared radiation emitted by the atmosphere is measured applying the so-called limb sounding technique (see Fig. 1). Hereby, a sequence of emission spectra from different tangent altitudes (Zmins) in the atmosphere is recorded. Fig. 2 shows a set of calibrated spectra recorded from different tangent altitudes (left). Such a set of calibrated spectra allows to retrieve vertical profiles of temperature and various chemical constituents. Molecular bands of individual trace gas species are marked by horizontal bars. The signal of the nitrogen reservoir species HNO3 changes strongly dependent on the tangent altitude of each spectrum which is given on the right hand side of the figure. The retrieved vertical profile for this species is also shown (right).
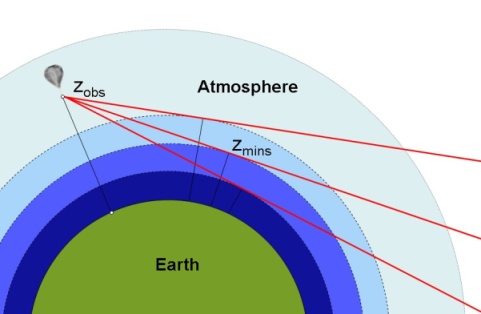
Fig. 1. The limb sounding technique.
Fig. 2. Sequence of spectra as recorded with the limb sounding technique (left) and retrieved HNO3 profile (right).
Since MIPAS-B measures the self emission of the atmosphere against cold space, it is independent of external light sources (like, e.g., the sun or the moon) and can measure in any viewing direction at any time of the day. Thus, several complete limb sequences (i.e. vertical profiles), e.g. from different azimuth directions can be recorded. The variation of the observed temperature along these measurement sequences is depicted in Fig. 3.
Such longer-lasting flights provide the possibility to observe the evolution of the concentration of short-lived species over their diurnal cycle. The molecule NO2 exhibits a strong diurnal variation in the stratosphere and is in photochemical equilibrium with NO and N2O5. Around sunrise, NO2 is rapidly photolysed and its volume mixing ratio is expected to decrease. This change is clearly visible in the MIPAS-B measurements (see Fig. 4).
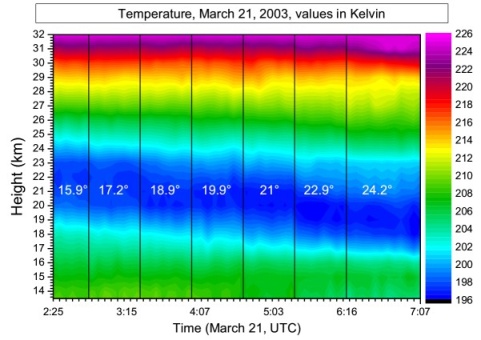
Fig. 3. Altitude-longitude temperature distribution at the edge of the polar vortex as measured on March 21, 2003 above Kiruna (Sweden). Longitudes are indicated by white numbers.
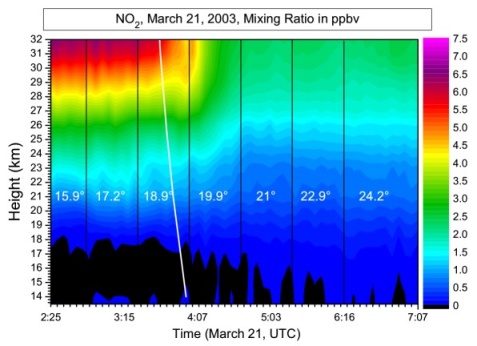
Fig. 4. Diurnal variation of NO2 around sunrise as measured on March 21, 2003 above Kiruna (Sweden).
The white line denotes the sunrise at the different altitudes.