
Data Analysis
Spectrometer:
FTIR-spectrometers are performing an optical Fourier transformation of the atmospheric radiation. In the Michelson interferometer, the incoming beam from the atmosphere is split into two partial beams which pass different distances. Then, the two beams are recombined again and send to the detector (see Fig. 1).
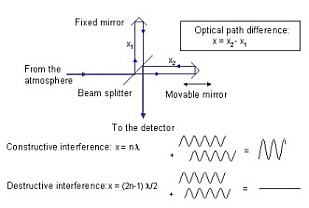
Fig. 1. Principle of a Michelson interferometer.
Fourier Transform (FT):
Depending on the optical path difference between the two partial beams and the wavelength of the incoming radiation, the recombined beam shows constructive or destructive interference. The measurement signal as a function of the optical path difference is the so-called interferogram (IFG). The corresponding spectrum can then be generated by retransforming the interferograms into spectra with a mathematical Fourier Transform (Fig. 2).
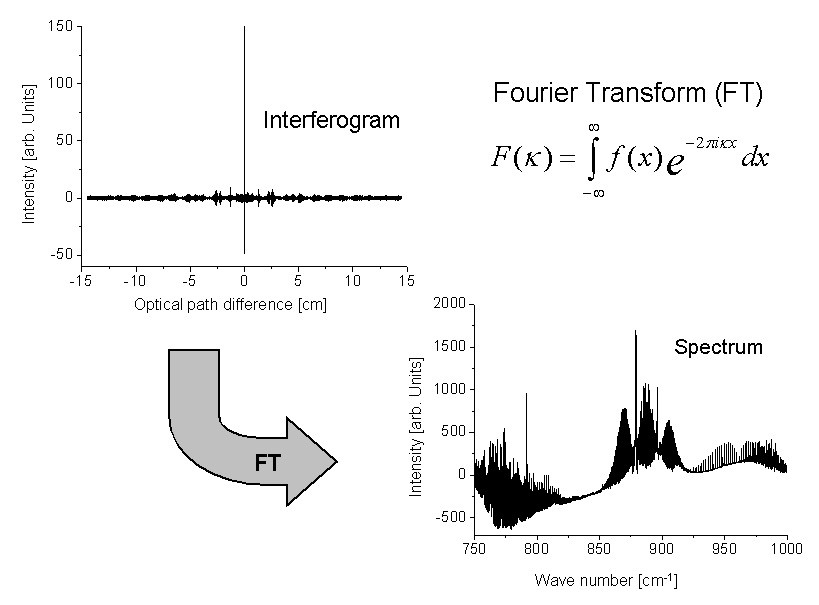
Fig. 2. The raw data of the FT spectrometer are interferograms (left). The corresponding spectra are calculated by means of the Fourier Transform (right).
Calibration:
The spectra need to be calibrated, i.e., absolute radiance units have to be assigned to the intensities measured. Furthermore, the instrument self-emission has to be removed from the atmospheric contribution.
The instrument self emission is determined by looking into "deep space". In order to assign absolute radiances to the spectra, measurements of an internal blackbody with known temperature are performed. The calibration formula is displayed in Fig. 3.
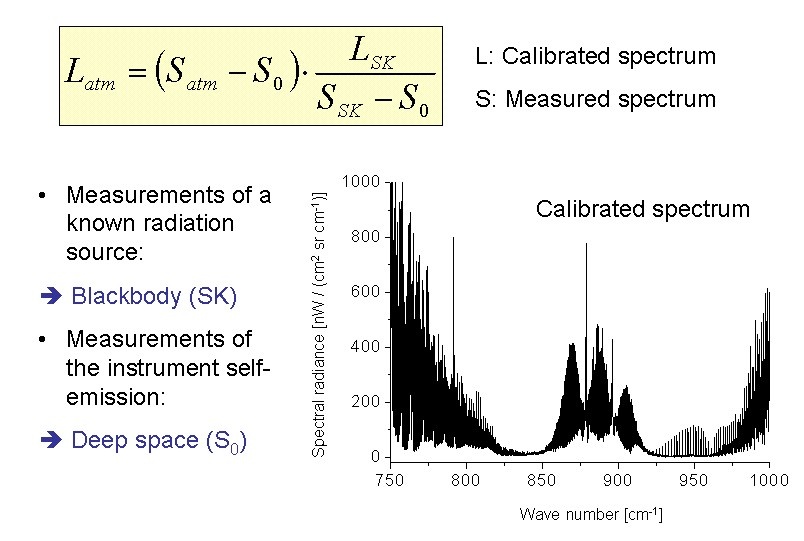
Fig. 3. The calibration assigns absolute radiances to the intensity of the spectra and removes the offset which is due to the instrument self-emission.
Retrieval:
Calibrated radiance spectra (see Fig. 4) are analyzed with a nonlinear least squares fitting procedure, as provided by the fit-version of the Karlsruhe Optimized and Precise Radiative transfer Algorithm (KOPRA). This is an iterative process where the algorithm fits the calculated spectrum to the measured one by adjusting guessed atmospheric parameters. An example of a best fit is given in Fig. 5. Spectroscopic parameters are mainly taken from the HITRAN database.
A priori information concerning atmospheric temperature is taken mainly from the European Centre for Medium-Range Weather Forecasts (ECMWF) analyses, those for atmospheric constituents from climatology. The error analysis includes a random error estimation considering spectral noise as well as the mutual influence (covariance) of the fitted parameters. Systematic errors as caused by an inaccurate knowledge of the line-of-sight (pointing) as well as temperature errors and uncertainties of the spectroscopic data are also taken into account in the total error budget.
The final output of this data processing are vertical profiles of temperature and trace gas constituents with an altitude resolution of about 1-3 km, covering the altitude range from the upper troposphere to the middle stratosphere (Fig. 6). Typical random errors of the retrieved volume mixing ratios are below 5%. Typical accuracies range from 5 to 15 % depending on the molecule and the altitude region. Analysed profiles are evaluated within the context of the ozone-relevant chemistry in cooperation with modelling groups.
Fig 4. Sequence of measured spectra in the spectral region between 778 and 980 wavenumbers. Seven different tangent altitudes (closest difference between the line-of-sight and the surface) are shown corresponding to different elevation angles. Dominant spectral features of emitting molecules are indicated. The zoom shows the Q branch region of the ?4 band of ClONO2 used for the analysis.
Fig. 5. Best fit within the region of the HNO3 transitions near 11.5 µm corresponding to a tangent altitude (Zmin) of 25.8 km. The intensity of the lines is first of all dependent on the atmospheric temperature and the concentration of the particular species.
Fig. 6. During a flight from Kiruna (Sweden, 68°N) on March 24, 1997, vertical profiles of all important nitrogen reservoir compounds were measured by MIPAS-B inside the arctic vortex and compared to 3-dimensional chemistry transport calculations by KASIMA (see, Wetzel et al., 2002). Such simultaneous measurements are especially useful to validate and improve chemical transport models because all of these species are coupled with each other.