
Measurements
The MUSICA dataset integrates three different measurement techniques:
Instructions for data download (data are freely available) can be found here.
Ground-based remote sensing
The ground-based remote sensing component of MUSICA consists currently of 12 stations, where ground-based FTIR experiments are operated in the framework of the NDACC (Network for the Detection of Atmospheric Composition Change). The stations are representative for different geophysical locations: Polar Regions, mid-latitudes, sub-tropics, and tropics. Their names, their locations, and the responsible institutions are listed in Table 1.
A ground-based FTIR experiment records the direct solar light beam. Figure 1 shows the solar tracker (left photograph) and the FTIR spectrometer (right photograph) as installed at the Izaña Observatory on Tenerife Island, Spain. The spectra have a typical spectral resolution of 0.005 cm-1.
For the analysis of the measured ground-based solar absorption spectra we apply the retrieval code PROFFIT. The retrieval of the water isotopologues is performed on a logarithmic scale and the vertical distribution of H2O and of HDO/H2O is optimally estimated. Figure 2 depicts the spectral windows applied for our retrievals in the 2650 - 3050 cm-1 region. In addition we perform H2O and HDO/H2O retrievals in the 1090 – 1330 cm-1 region. The FTIR spectra of both spectral regions allow generating tropospheric H2O profiles from the surface to the upper troposphere (degree of freedom for H2O is about 2.8) and distinguishing lower from middle tropospheric HDO/H2O (degree of freedom for HDO/H2O is about 1.6).
The 2650 - 3050 cm-1 region also allows retrievals of CH4 and N2O profiles (among others).
Table 1: Overview of collaborating ground-based FTIR stations: sites, coordinates, and managing institutions.
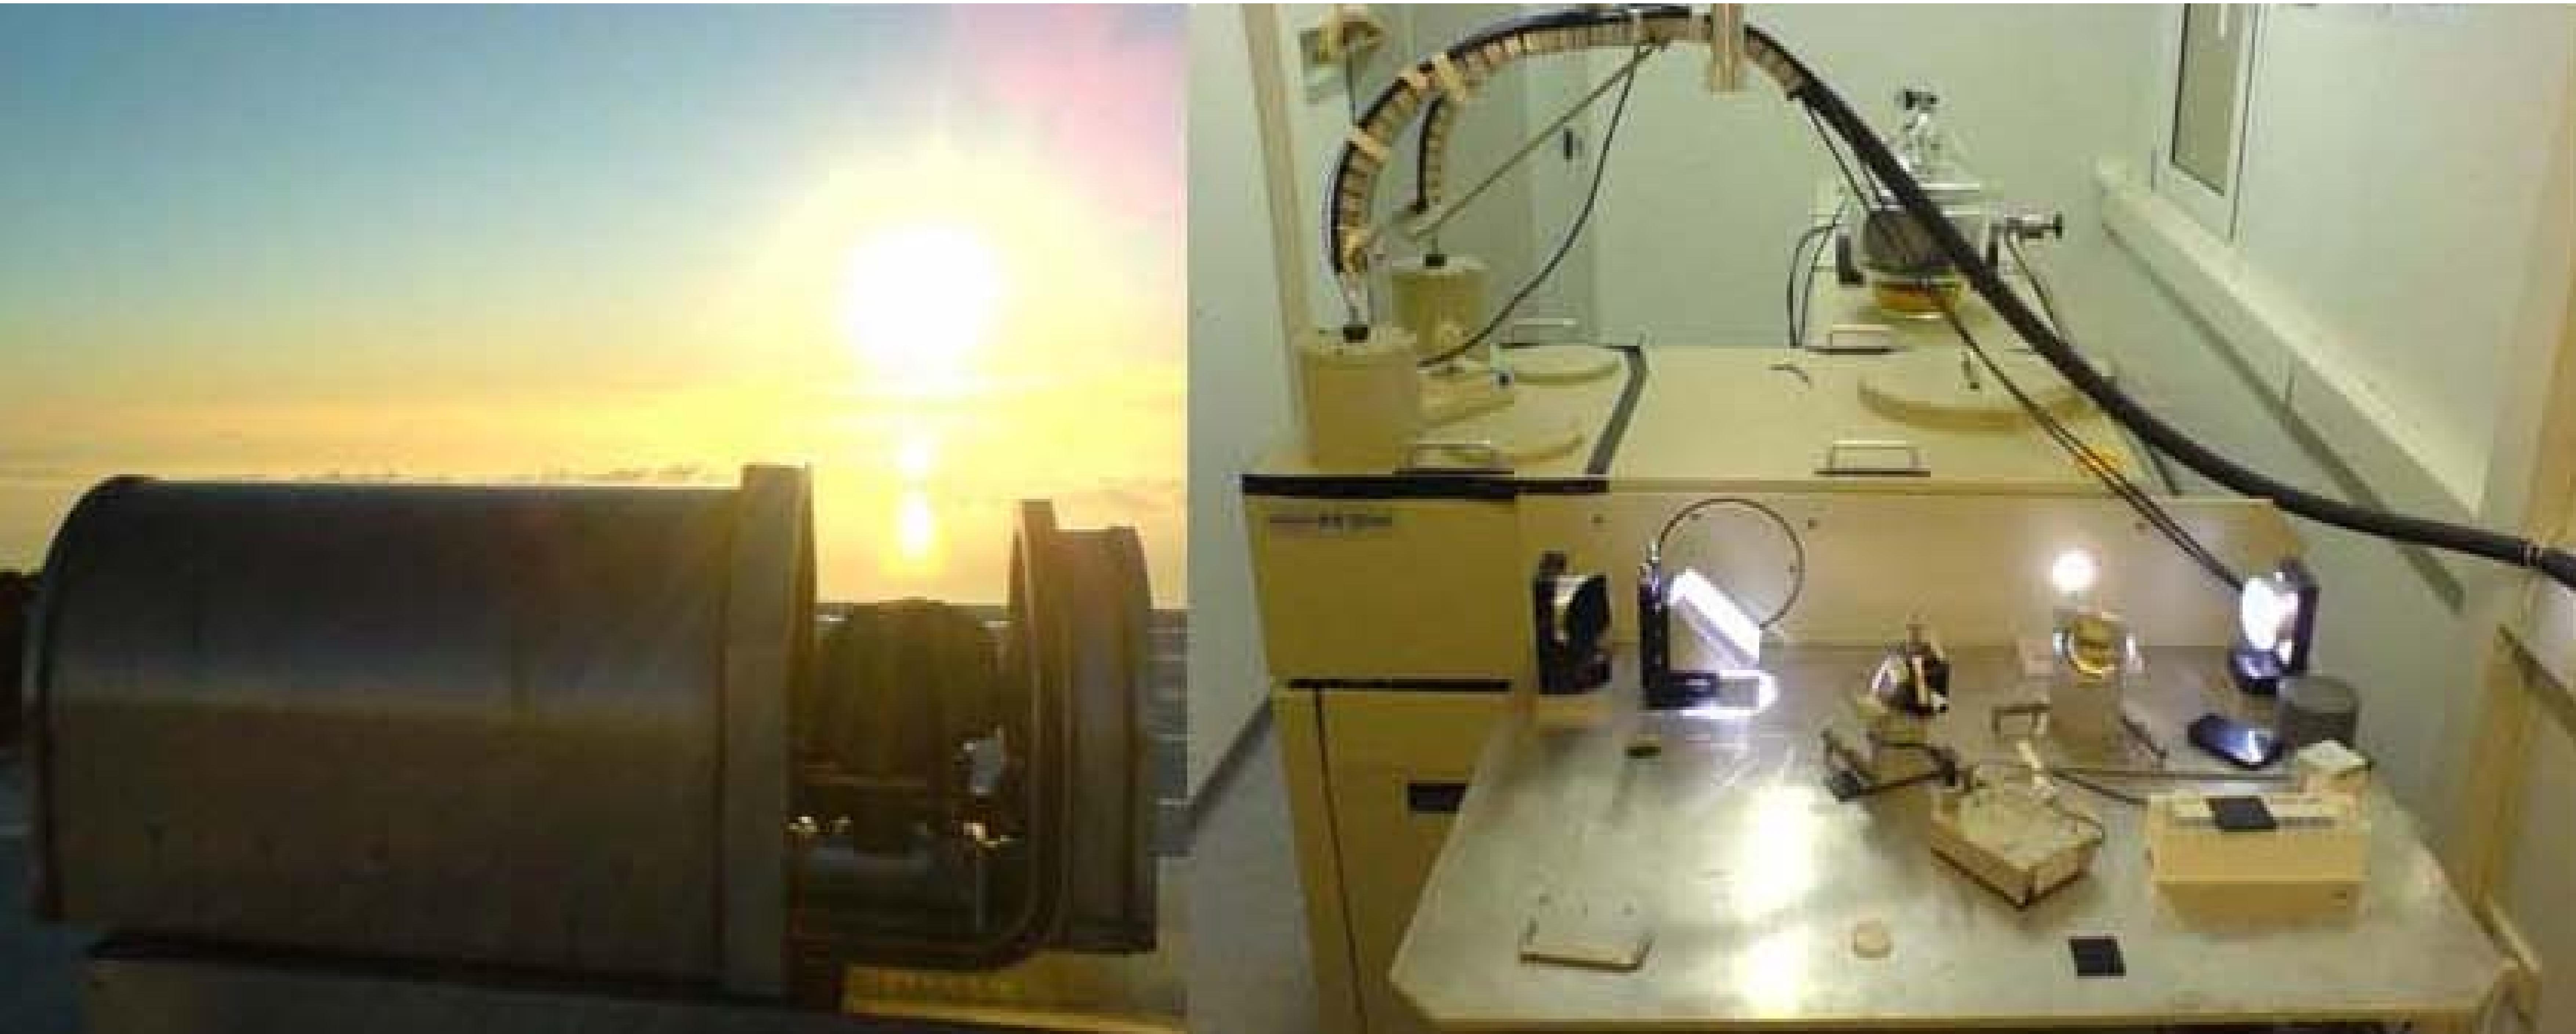
Figure 1: The ground-based FTIR experiment at the Izaña Atmospheric Research Centre. The solar tracker (left photograph) is situated at the top of the experimental housing. It collects the direct solar beam and reflects it into the housing of the FTIR spectrometer (right photograph). There it is analysed by a quadrant detector, which together with astronomical calculations controls the solar tracker. Then the solar beam is coupled into the interferometer (circular light spot on the right part of the photograph).
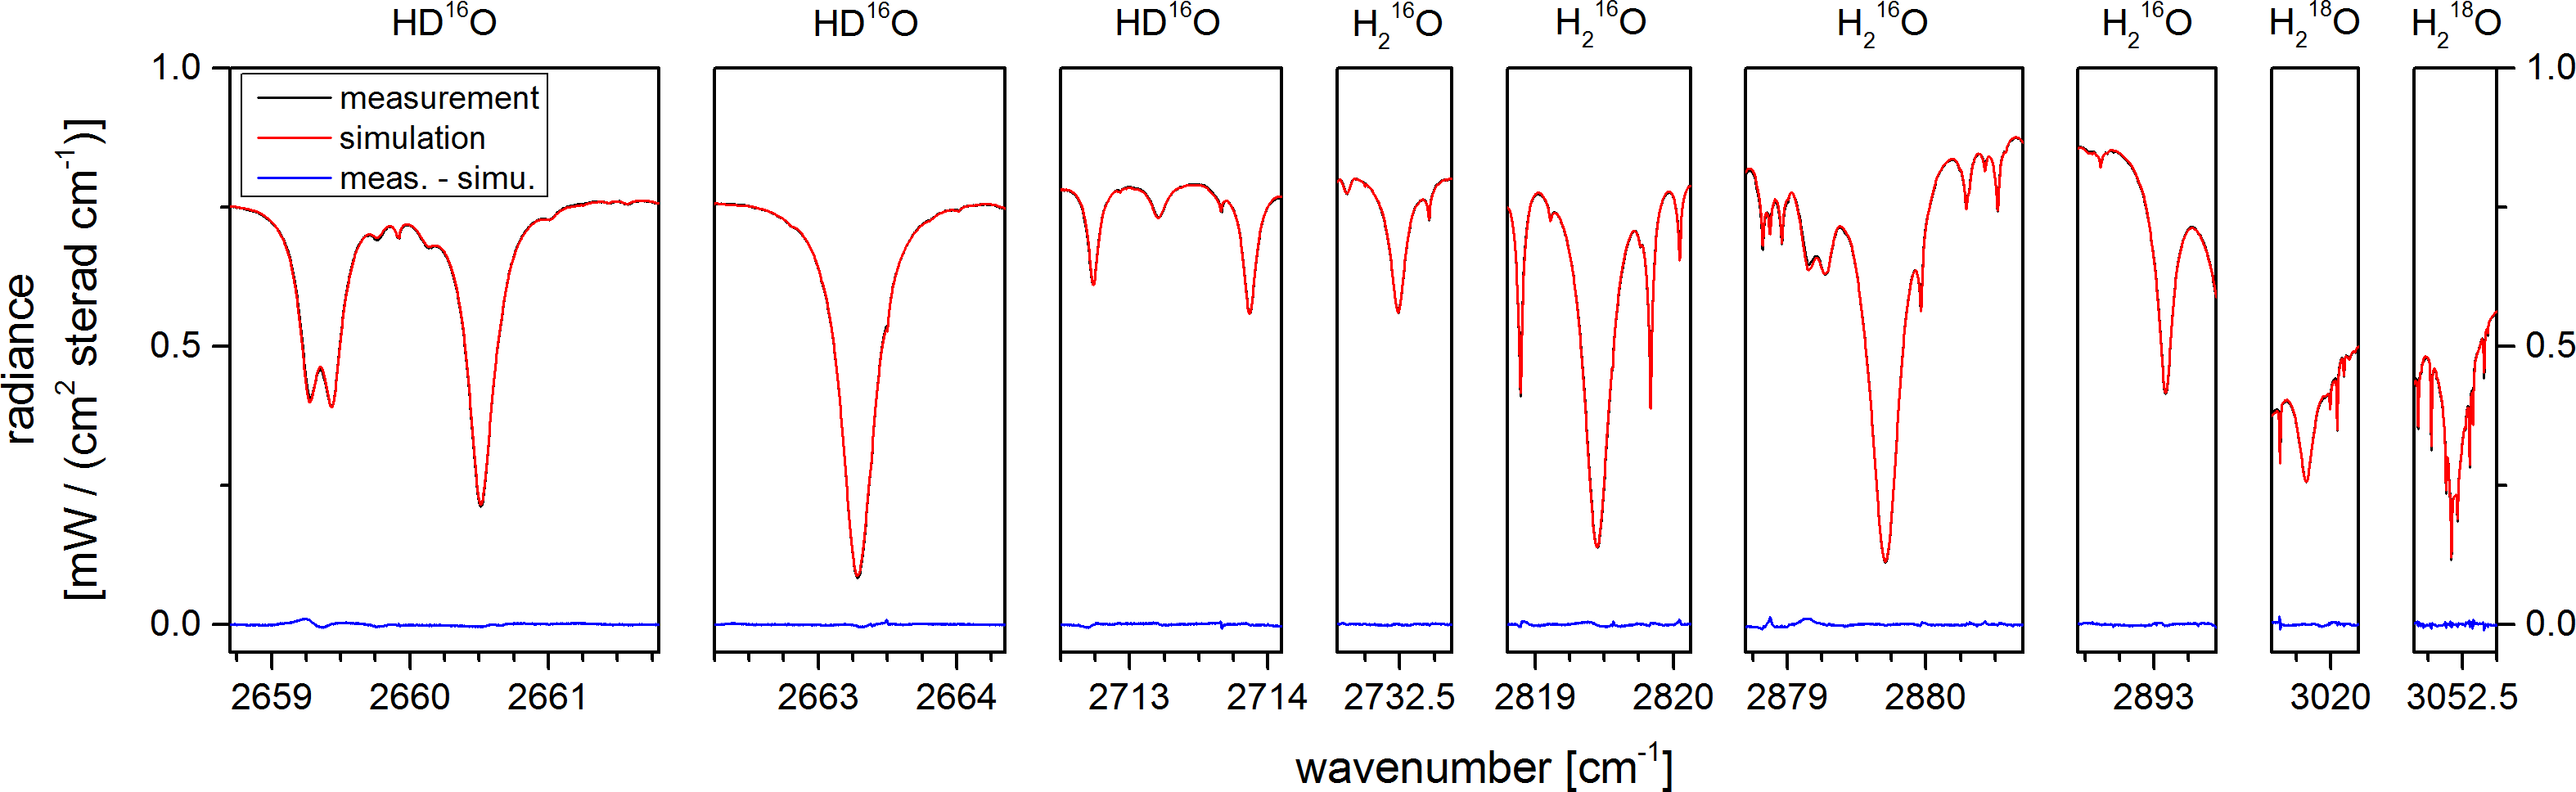
Figure 2: Spectral windows applied for the ground-based H2O and HDO/H2O retrieval in the 2650 – 3050 cm-1 region. Black line: example of a measurement; Red line: simulated measurement; Blue line: residual (difference between measurement and simulation).
Space-based remote sensing
For the space-based remote sensing of the water vapour isotopologues we apply the thermal nadir spectra measured by IASI (Infrared Atmospheric Sounding Interferometer) since 2006. IASI is very interesting for water cycle research, since it is flown aboard EUMETSAT’s operational meteorological polar orbiter METOP and combines global coverage with high horizontal and temporal resolution: despite its small pixel size of 12 km diameter it covers almost the whole globe twice per day. Furthermore, IASI measurements will be guaranteed between 2006 and 2020 on a series of three METOP satellites. Figure 3 shows the METOP satellite and a sketch with IASI’s observation geometry. For more details please refer to the EUMETSAT web page.
IASI records the thermal infrared emission of the Earth-atmosphere system between 645 and 2760 cm-1 with an apodized spectral resolution of 0.5 cm-1. Figure 4 depicts an IASI measurement, a simulation of this measurement, and the difference of both of the spectral window that we apply for our retrieval. The selected spectral window covers the region between 1190 and 1400 cm-1. In this region there are strong lines of different water vapour isotopologues. For the analysis of the IASI spectra we apply the retrieval code PROFFIT-nadir, which is an extension of PROFFIT. The retrieval strategy is the same as in the case of the ground-based FTIR spectra: logarithmic scale inversion and optimal estimation of H2O and HDO/H2O. For subtropical clear sky conditions over the ocean we get about 3.5 and 0.7 degrees of freedom for tropospheric H2O and HDO/H2O, respectively. Our IASI H2O product is well sensitive throughout the whole troposphere (surface – 13000 m a.s.l.) and our HDO/H2O product only to the middle troposphere (1500 – 7000 m a.s.l.).
In addition the MUSICA MetOp/IASI retrieval processor retrieves upper tropospheric CH4 and N2O concentrations.
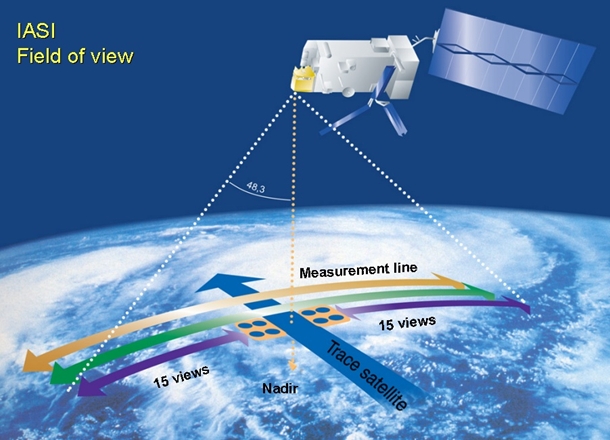
Figure 3: The IASI instrument on the METOP satellite and its observation geometry (Courtesy of EUMETSAT).
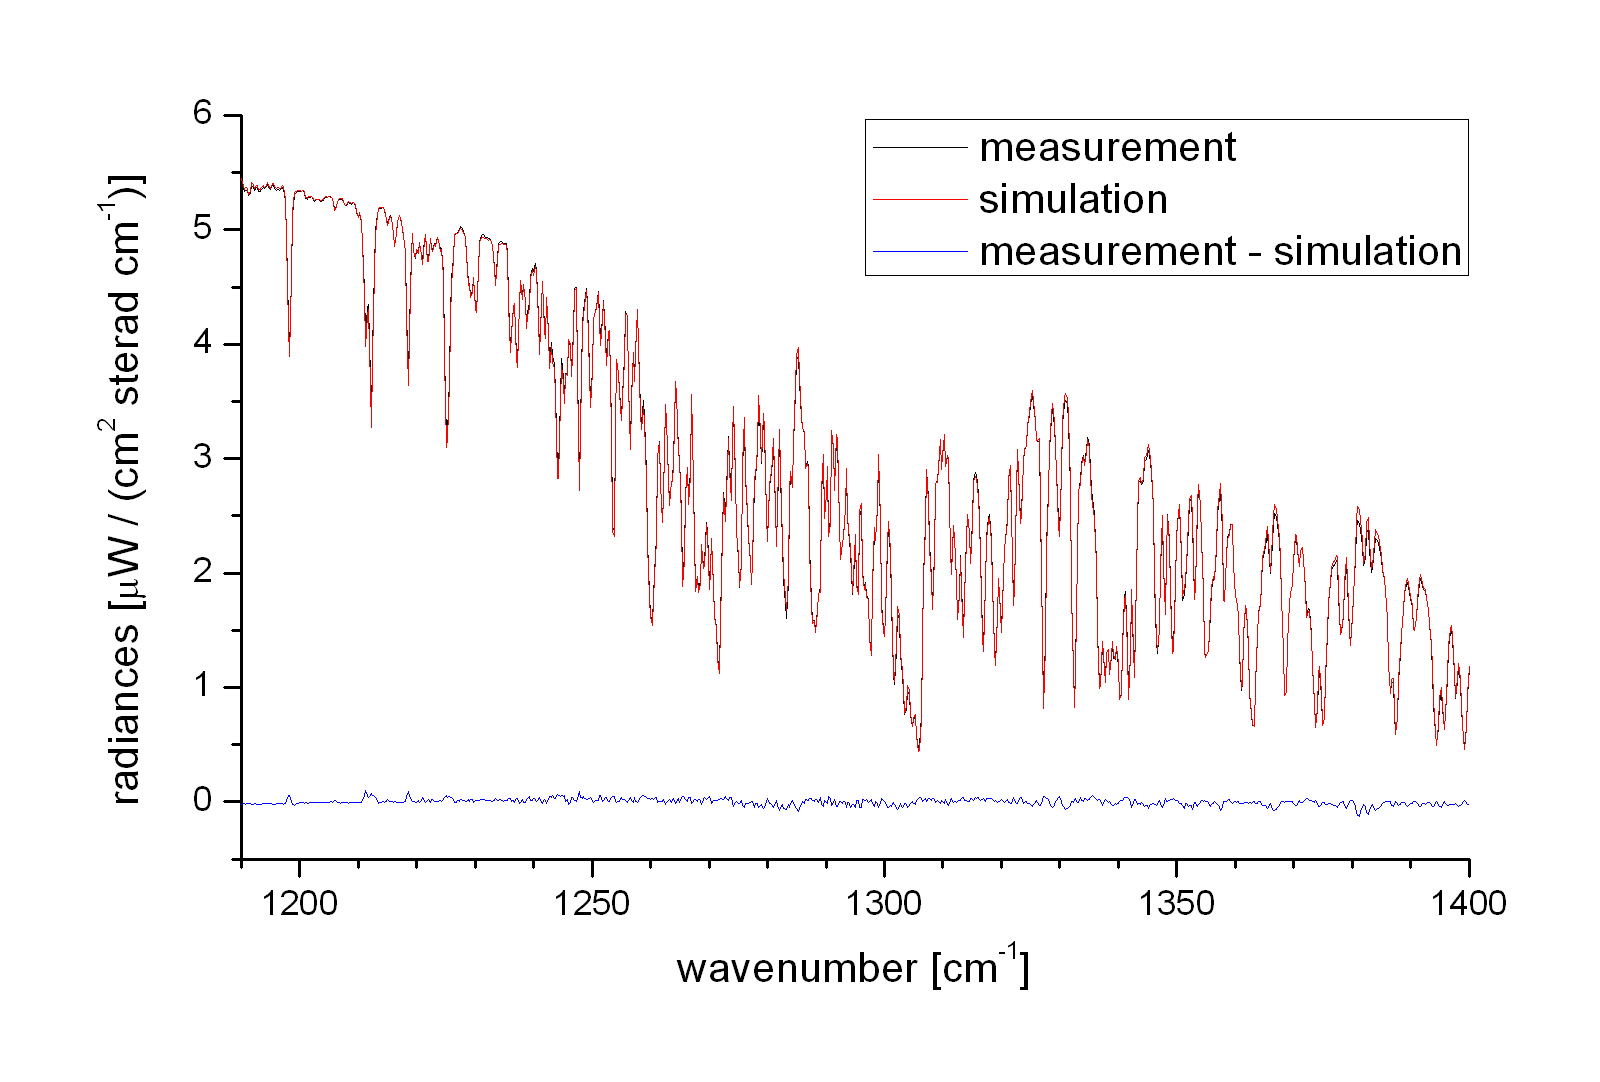
Figure 4: Spectral region applied for our H2O and HDO/H2O retrieval. Black line: example of an IASI measurement; Red line: simulated IASI measurement; Blue line: residual (difference between measurement and simulation).
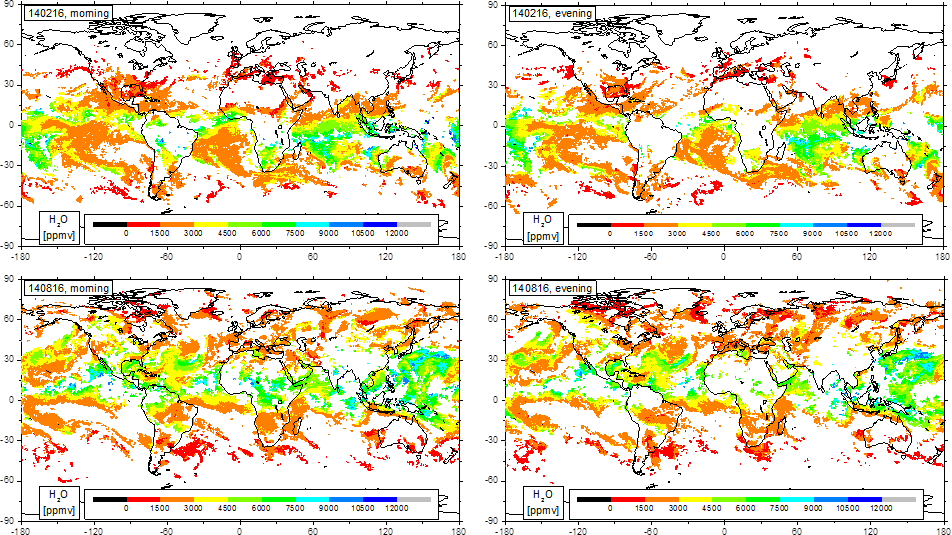
Figure 5: Daily morning and evening coverage for the MUSICA IASI-A and IASI-B {H2O,δD} pair retrieval product that passed the sensitivity filter for 4.9 km altitude. Shown is the H2O data as an example. Left panels show the morning overpass and the right panels show the corresponding evening overpass. Top panels are for a typical situation during northern winter (example 16 February 2014) and bottom panels for northern summer (example 16 August 2014). For more details please see Schneider et al., 2016.
In-situ measurements
In close collaboration with the Tropopause research group (TOP) of IMK-ASF we have generated a consistent in-situ water vapour isotopologue data set for different tropospheric altitudes: lower, middle, and upper troposphere.
A commercial in-situ water vapour isotopologue analyzer (Picarro L2120-i) has been installed in Karslruhe and at two stations on Tenerfie Island: the Izaña Observatory at about 2400 m a.s.l. (see Figure 6) and the Teide Observatory at about 3550 m a.s.l.. The Picarro instruments have continuously measured tropospheric H216O, H218O/H216O, and HD16O/H216O.
In addition tropospheric H216O and HD16O/H216O profiles ihave been measured in the surroundings of Tenerife Island between 50 and 6900 m a.s.l. during an aircraft campaign in summer 2013. For these aircraft measurements we apply the ISOWAT water vapour in-situ isotopologue instrument.
The in-situ data set will be used for validating the H2O and HDO/H2O remote sensing products.
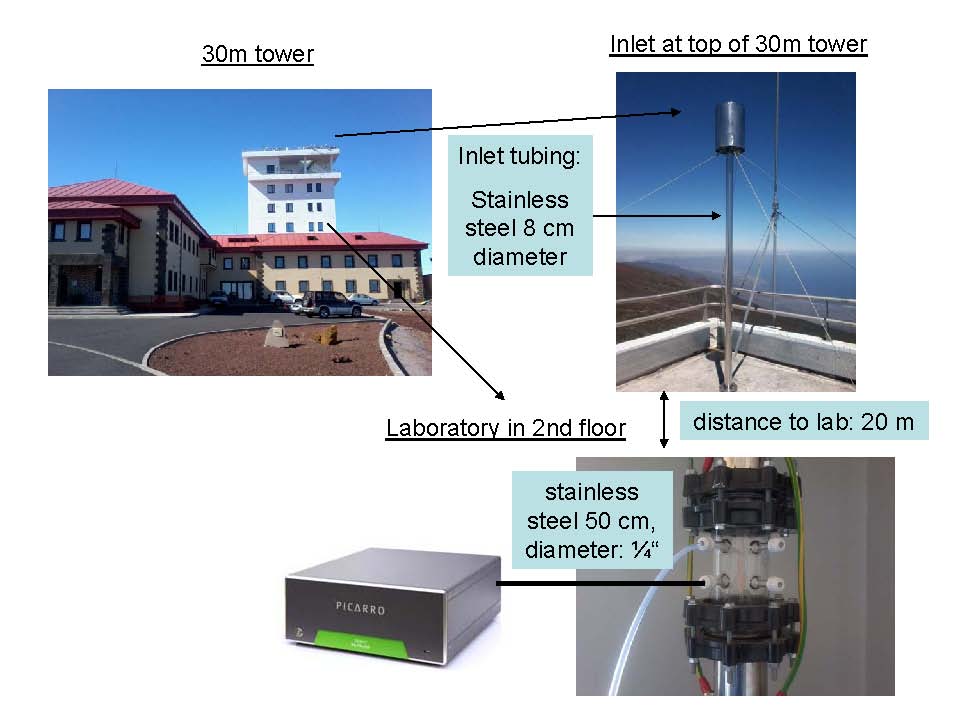
Figure 6: Diagram of the continuous water isotopologue in-situ measurement system at the Izaña Observatory.
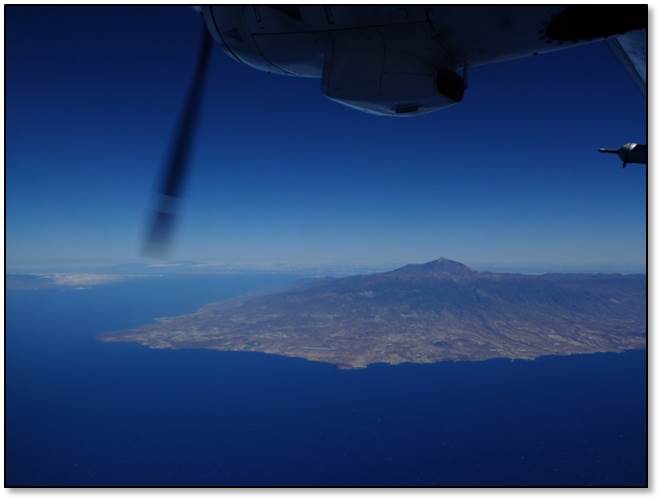
Figure 7: Tenerife Island as seen from the aircraft during a campaign research flight in July 2013.