Proton-Transfer-Reaction-Mass Spectrometer for organic compounds
Proton-Transfer-Reaction-Mass Spectrometer (PTR-MS) onboard aircraft
Our group develops and deploys PTR mass spectrometers for the detection and monitoring of volatile organic compounds (VOCs) like e.g. acetone, methanol, acetaldehyde, isoprene or acetonitrile. The development started in 2002, at the beginning based on a strongly modified instrument and since 2008 with custom-made systems.
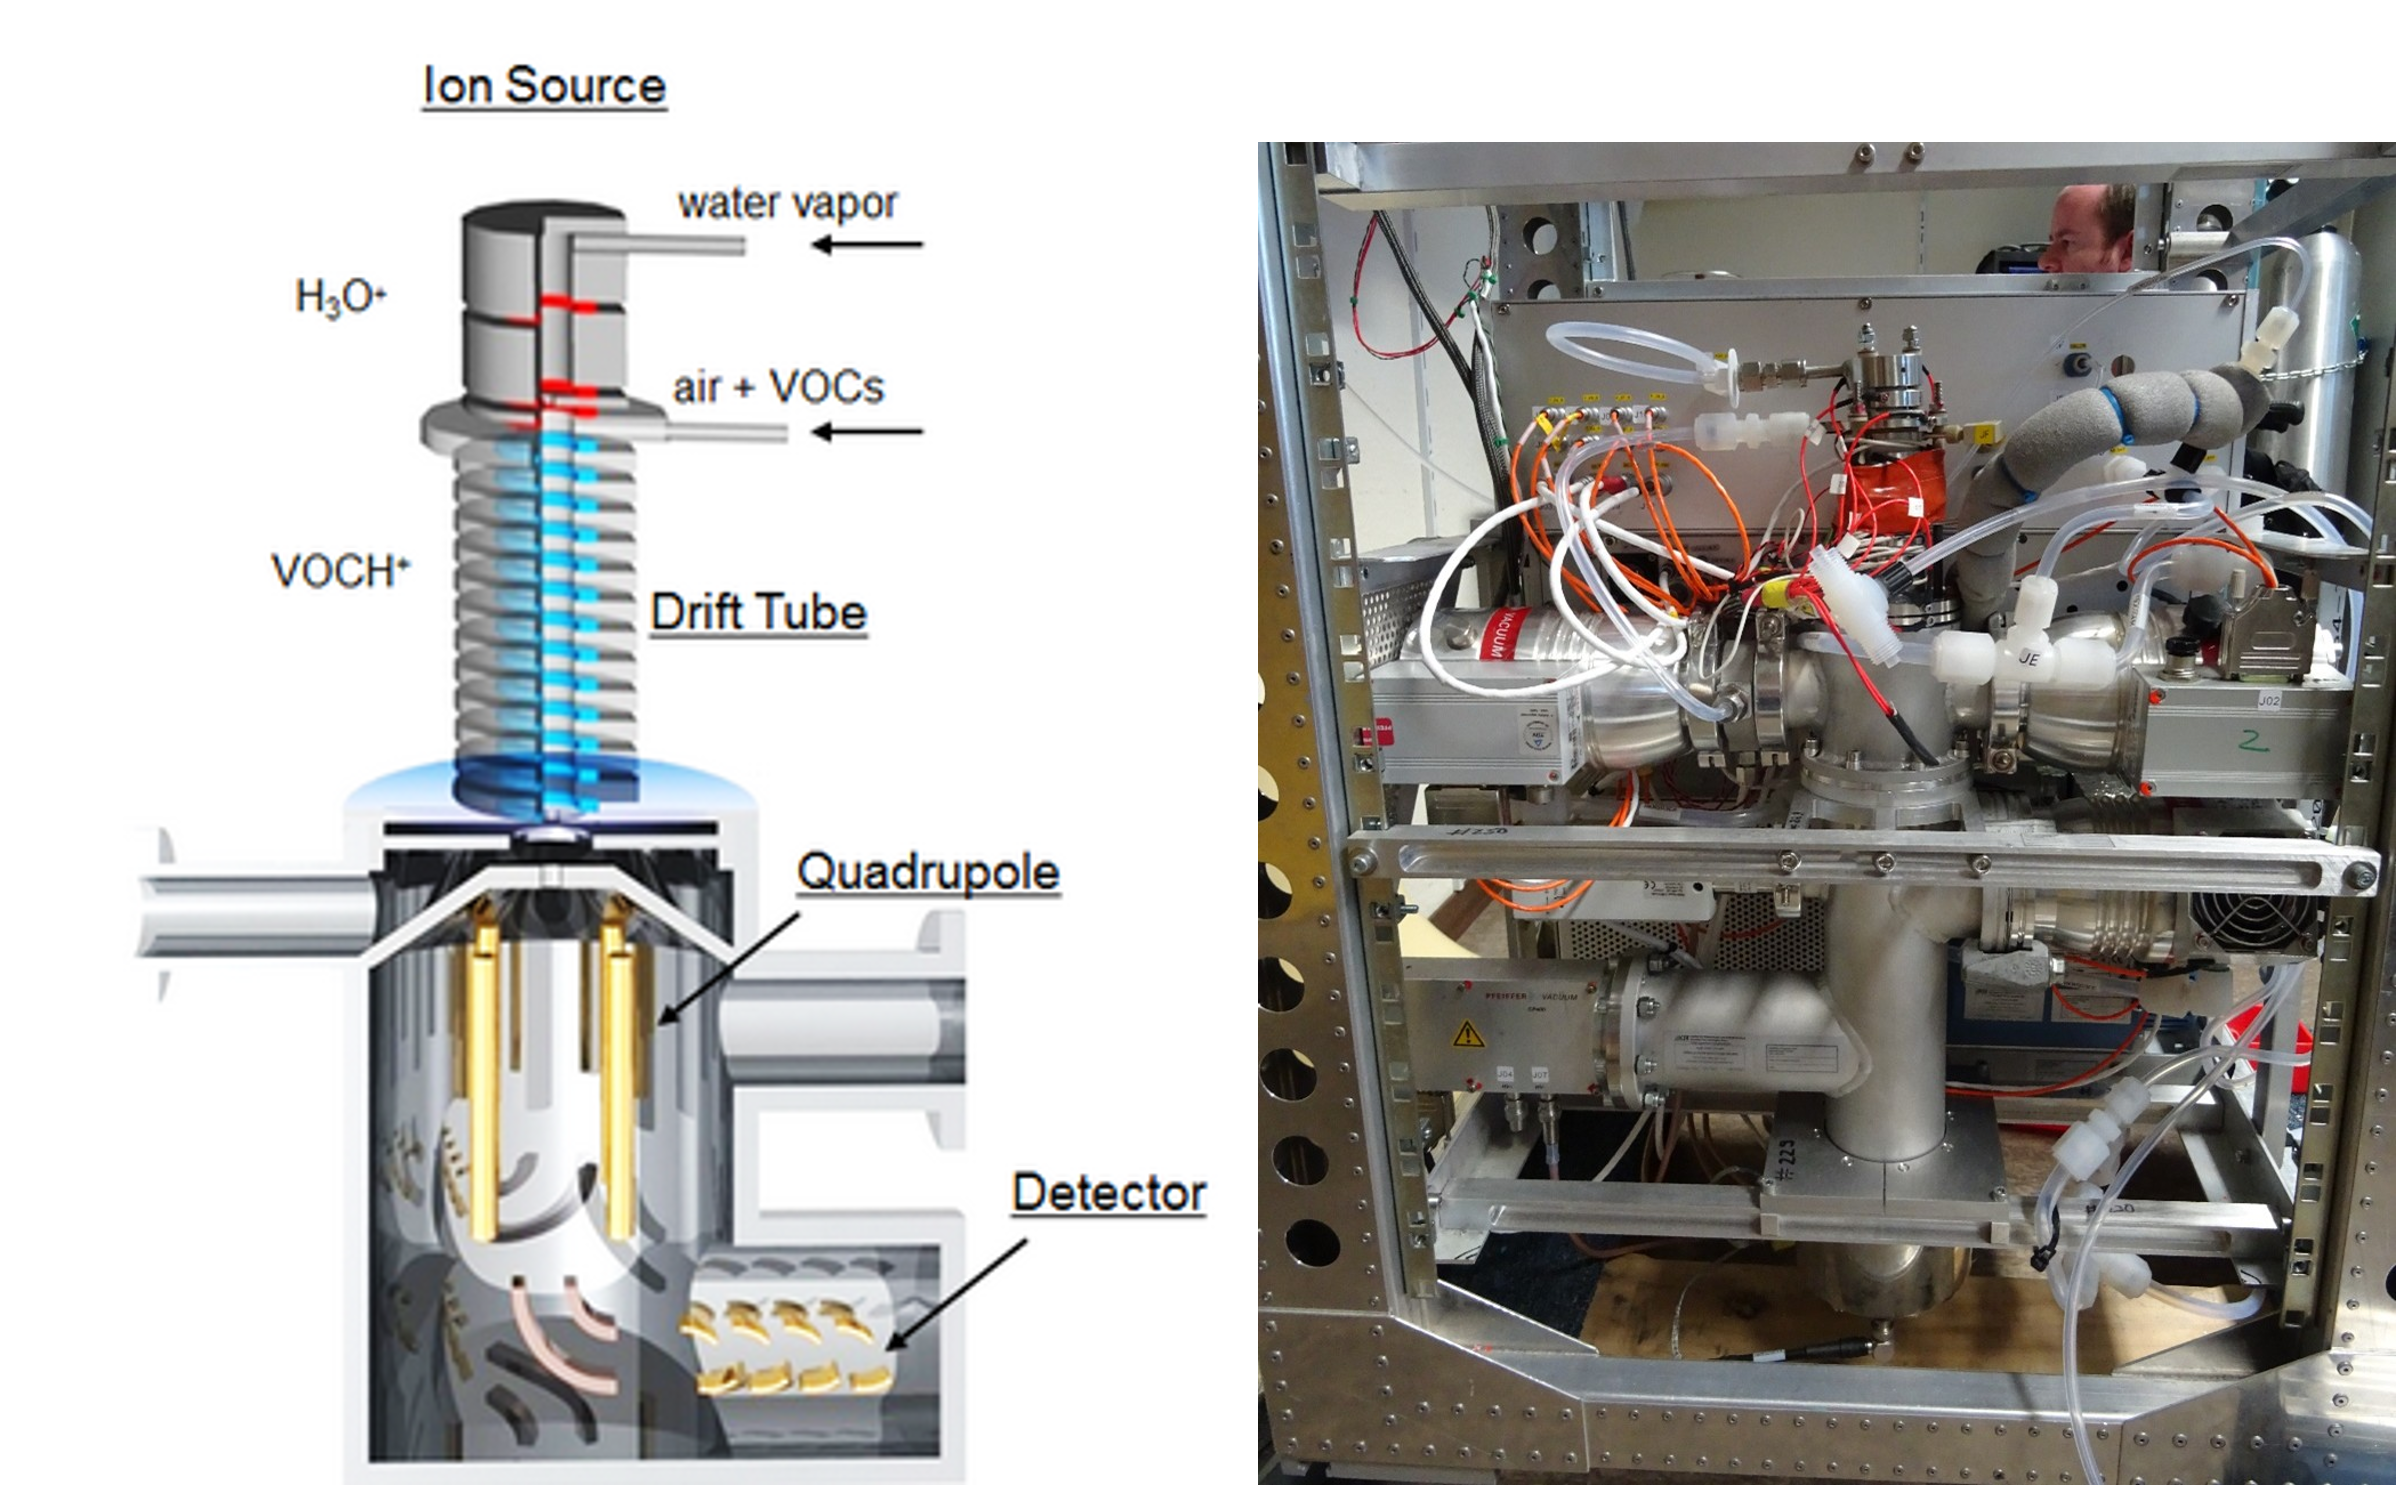
A PTR-MS is a chemical mass spectrometer that is based on soft proton transfer from H3O+ (gener-ated in a hollow cathode ion source) to volatile organic compounds (VOCs) at low pressure (~2 hPa).
Our PTR-MS are with ~55 kg much lighter than commercial instruments and are fully automated and aircraft-certified.