
Data inhomogeneities can distort trend analysis
Long data sets as needed in climate research without any inhomogeneities are sparse. Thus, a method to deal with data inhomogeneities has been developed at IMK.
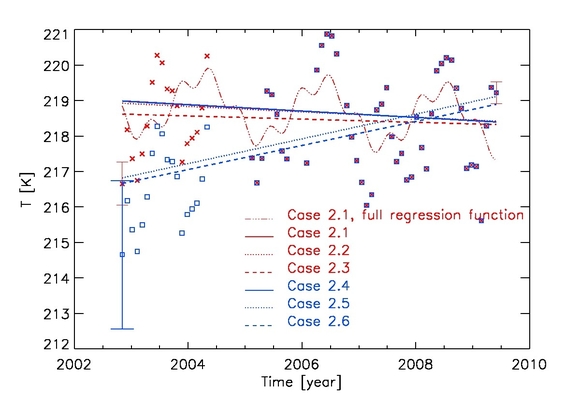
The temperature trend in the tropics at 25 km altitude as measured by MIPAS (red x-symbols) is slightly negative (red lines). A bias of -2K superimposed to the data subset 2002-2004 (blue boxes) implies an artificial positive trend if ignored (dotted blue line) or considered as additional independent error (dashed blue line). Correct treatment of the data inhomogeneity by consideration of the full data error covariance matrix leads to the correct trend (blue solid line), although no debiasing was done prior to the fit.
All straight lines in the figure represent the linear term of the fitted function, while the dash/dotted line represented the full fit including the quasi-biennial oscillation and the semi-annual oscillation. For details see here: