
2008/2009 Polar Winter Chemistry and Dynamics as Seen by MLS/Aura and MIPAS/Envisat
In a collaboration between The MLS/Aura team of NASA's Jet Propulsion Laboratory and the MIPAS/Envisat team at IMK, two animations were created to visualize chemistry and dynamics of the lower stratosphere at the northern and southern polar regions during the respective winter seasons. Click on images to get the respective animations (each 150 MB).
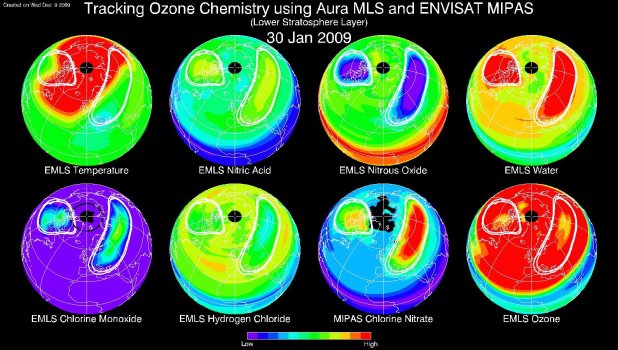
The northern hemisphere animation extends from November 1, 2008 through Mar 31, 2009 and shows the effects associated with the split of the polar vortex (at January 27) on the 520 K potential temperature surface. The black circle in the ClO-panel indicates the boundary between sunlit and dark locations.
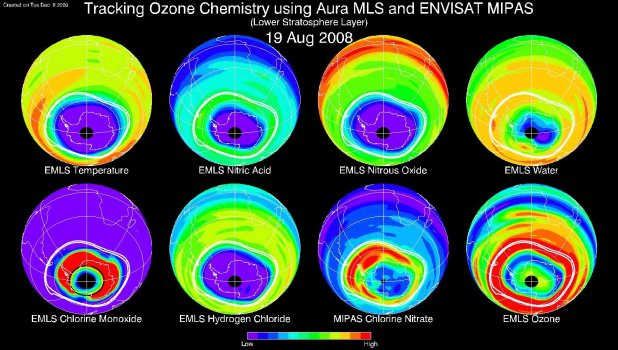
In the southern hemisphere animation, ranging from May 7 until October 31, 2008, the build-up of the ozone hole during increasing illumination of the polar region can nicely be followed in the stable polar vortex on the 490 K potential temperature surface (meaning of black circle in ClO-panel as for northern hemisphere).