
Biomass burning and industrial pollution mapped by MIPAS HCN and C2H6
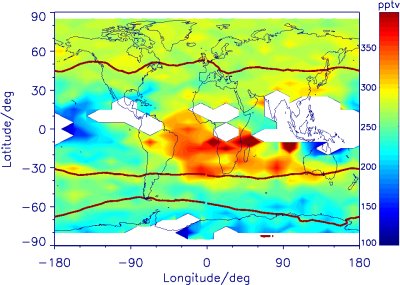
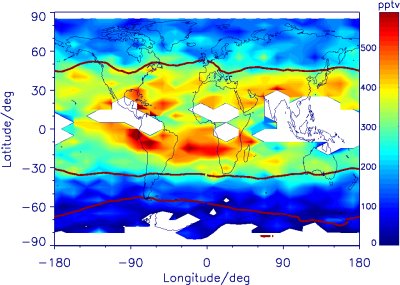
Global HCN (top) and C2H6 (bottom) distributions at 200 hPa (10.5-12.6 km), measured by MIPAS in September 2003. White areas are data gaps due to cloud contamination (or insensitive values in case of C2H6 south of 60° S). Red solid lines show the monthly averaged tropopause intersection from the NCEP reanalysis.
Strongly enhanced values of HCN between South America, Africa and Australia reflect the southern hemispheric biomass burning plume. Enhanced C2H6, an indicator for both biomass burning and industrial/urban pollution, is also visible in this region, but additionally west of Peru and in the northern tropics and subtropics. Trajectory calculations (not shown) hint towards pollution sources in Northern South-America.
For further details see: http://www.atmos-chem-phys.net/9/9619/2009/acp-9-9619-2009.html