
The role of natural variability in satellite ozone validation
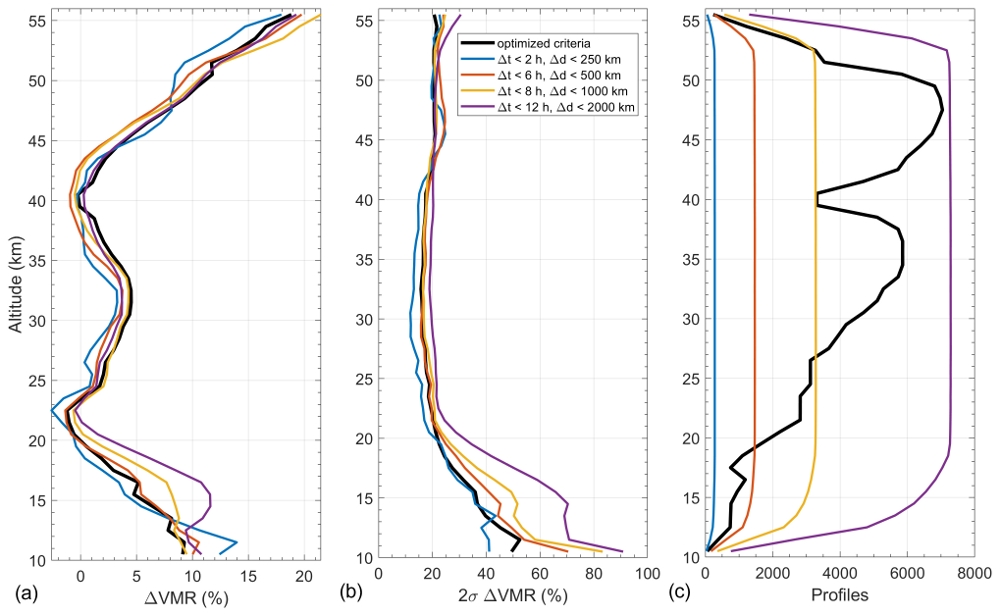
The left panel shows the mean relative difference between ACE-FTS and OSIRIS ozone profile measurements for various coincidence criteria in terms of spatial and temporal distance. In the middle panel the two-sigma variation of the relative differences are shown. In the right panel the number of available coincidences is shown. More strict coincidence criteria lead in general to better agreement between ACE-FTS and OSIRIS. However there is a price to pay in that the number of coincidences is smaller, leading to a less significant comparison. The black curve represents an optimized coincidence criterium based on modelled natural variability and maximal allowable natural variability. This work was performed in the framework of the TUNER SPARC activity and has recently been published in the AMT TUNER special issue .
The problem with satellite data intercomparisons is that often the role of natural variability of the target quantity in combination with less than perfect coincidences is not quantified. Sheese et al. have estimated the contribution of the natural variability to the differences between ACE-FTS and OSIRIS measurements with the WACCM model. Coincidence criteria were chosen in a way that natural variability accounts for less than 10% above 17 km and less than 15% below.
For more information see: https://doi.org/10.5194/amt-14-1425-2021