
Evolution of temperature and nitric acid in the unusually cold Arctic winter 2010/2011 is seen by MIPAS and MLS consistently
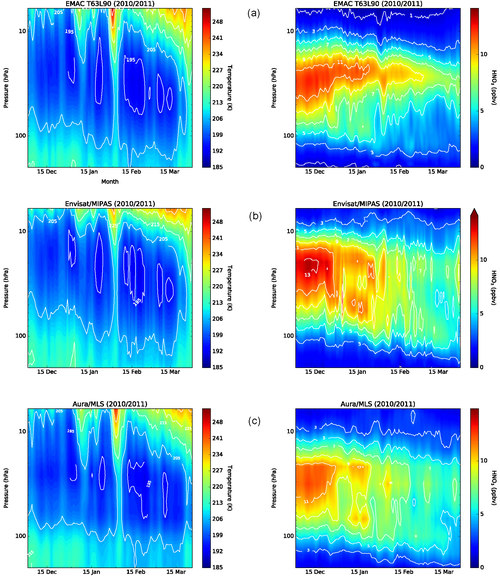
The figure shows the 70-90oN zonal means of the vertical distribution of temperature (left) and nitric acid (HNO3, right) from data of MLS (bottom), MIPAS (middle), and the chemistry-climate model EMAC (top). The evolution of temperature over this cold polar winter is represented in a remarkably similar way by the two satellite observations, including the minor warming at the beginning of January, beginning of February, and end of March. While there is a difference in the absolute values of HNO3 between MLS and MIPAS in the order of 10% (which is still under investigation), the morphology and the altitude distribution again agree very well. In particular, the second lower branch of enhanced HNO3 around 50hPa (and subsiding further) develops at the same time. It is due to sedimentation of PSC particles into lower atmospheric layers and re-evaporation there. This process is not represented well in the EMAC simulations.
The agreement between the satellite observations is actually surprising given the fact that the sampling of the two instruments is not identical (different orbits, different local times, differently dense sampling along the orbit) and the distributions of trace gases in the polar vortex is highly variable. This comparison demonstrates that densely sampling limb sounders provide a very reliable picture of the atmosphere's state despite they travel on low earth orbits and cannot provide gapless coverage. Their data are extremely valuable for the development of better chemistry-climate models for more reliable predictions of the atmosphere's future.
For more details on the comparison between the model simulations and the observations see:
https://www.atmos-chem-phys.net/18/8873/2018/