
Discrepancies between lower stratospheric water vapour time series from Boulder frost point hygrometer data, satellite measurements and model simulations remain unexplained
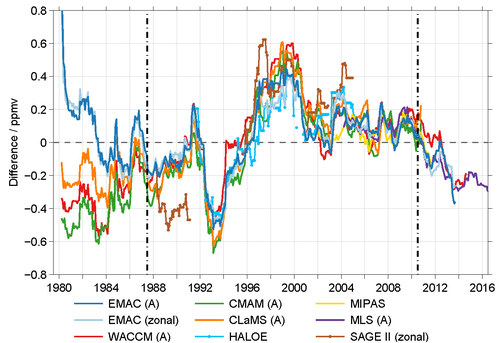
The figure shows the differences between the de-seasonalised water vapour time series obtained from the frost point hygrometer (FPH) observations at Boulder, and satellite measurements and model simulations at the location of Boulder, or for the zonal mean around the Boulder latitude, all at 70 hPa. Results labelled with the suffix (A) are adapted to the actual FPH observations at Boulder in terms of measurement time, while other data points are measurements/simulations averaged over a month, either within a 1000 km radius and 35-45oN, or for the 35-45oN zonal mean (the latter marked by "zonal"). The time ticks consider the middle of the specified years. The differences to the FPH data are similar for all satellite and model data sets. Given the extreme care in obtaining, controlling and characterizing the FPH measurements, the observed discrepancies are not yet understood. A possible explanation could be that the simulations and satellite observations underrepresent variability, or that the trend differences originate from smaller spatial and temporal scales than are resolved by the model simulations or satellite measurements (i.e. sub-grid processes).
The study was initiated by discrepancies between satellite data and Boulder frost point hygrometer data found within a previous study (Hegglin et al., Nature Geoscience, 2014). It was argued there that the discrepancy may be caused by Boulder FPH data not being representative for the zonal mean. In our study we compared both zonal mean data and data around the location of Boulder from satellite measurements and model simulations with FPH data and found no relevant difference. All satellite data and most of the model simulations agree rather well with each other while their time series provide pronounced differences to the FPH data. These discrepancies still require explanation. On the positive side we found that the location around Boulder is a good representative of the zonal mean, and even of larger latitude regions up to the near-global mean (60oS - 60oN).
For more information see: https://www.atmos-chem-phys.net/18/8331/2018/