
MIPAS ozone trends reveal distinctly resolved complex patterns
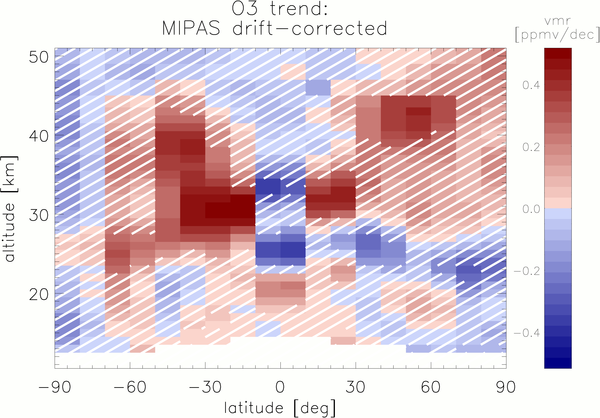
This figure shows the trend in stratospheric ozone - between 10 and 50km - as derived from MIPAS measurements for the time period of July 2002 to April 2012. Hatched areas denote trends which are less than twice as large as their error and, thus, less significant than to the 2-sigma level.
The assessed trends are hemispherically asymmetric, with larger positive trends in the Southern hemisphere. While positive trends can be found just above the tropical tropopause, only negative trends appear above. These negative trends show two clear maxima around 25 and 35km. Small negative trends appear in Northern lower stratospheric regions, while no significant trends could be found in the Southern hemisphere at similar altitudes.
Positive or near zero trends were also found by other authors. Negative trends just above the tropical tropopause are postulated by models, indicating an increase of the Brewer-Dobson circulation. The latter is contradictory to the trends from MIPAS. The MIPAS trends can be mimicked by a shift of the subtropical mixing barriers to the South below 30km and a widening of the tropical pipe above that altitude.