
Variations in middle atmospheric water vapor from 2004 to 2013
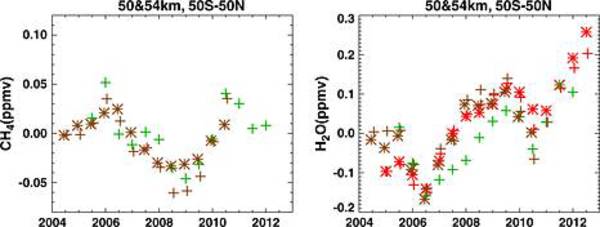
The water vapor anomaly shows that water vapor was at a minimum for the observation period in 2006. The inter-annual variations of methane and water vapor are strongly anti-correlated, and indicate methane oxidation as a relevant source of water vapor in these altitudes. The amount of methane is dependent on dynamical processes (the older the air, the more methane has been oxidized to water vapor). The variation of methane of +- 0.08 ppmv can explain about 0.16 to 0.24 ppmv variation in water vapor. It does not explain the strong overlaid positive trend in the water vapor anomaly, with an overall increase of almost 0.47 ppmv (min to max). This increase is consistent with a rise of tropical tropopause temperatures which is most pronounced from 2006 on (here, the tropical tropopause temperatures have been averaged over five years and assigned to the end of the five-year period, in order to account for the time the air needs to travel from the tropopause to the stratopause region). Increasing tropical tropopause temperatures and, hence, increased water vapor entry through the tropopause, seem to be the most plausible explanations for the overlaid over-all increase of water vapor.
For further details see http://onlinelibrary.wiley.com/doi/10.1002/jgrd.50834/abstract