
Temporal variation of water vapor around the stratopause
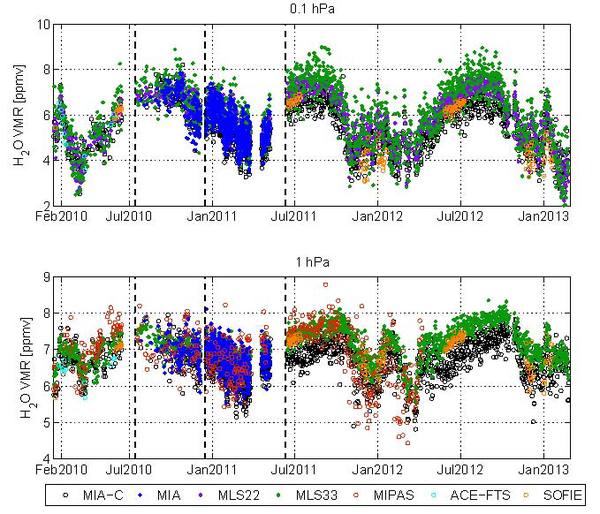
The figure shows the temporal evolution of water vapor at 1 hPa (lower panel) and 0.1 hPa (upper panel) between February 2010 and February 2013 as observed at two different stations and by several ground-based micro-wave and satellite instruments. The stations are Sodankylä in Finland (about 67 deg N) (periods Jan to Jun 2010 and Jun 2011 to Feb 2013), and Zimmerwald in Switzerland (about 47 deg N) (Jul 2010 to May 2011). The dashed vertical lines indicate the observation periods. The instruments are identified by the colors as given in the legend. All instruments give a consistent picture of the strong variations of water vapor around the stratopause.The variations in both altitudes are mostly correlated in time, but of different amplitudes. The seasonal variation of water vapor is more pronounced at 0.1 hPa (low water vapor during winter due to mesospheric subsidence, high water vapor during summer due to polar summer upwelling).
The figure is taken from a comparison of a new microwave ground-based instrument called MIAWARA-C to another established microwave ground-based instrument (MIAWARA) and several satellite instruments. Overall, the measurements from the different instruments show good agreement to each other. For more details of the comparison, see http://www.atmos-meas-tech.net/6/1725/2013/amt-6-1725-2013.html.
This kind of intercomparison is a valuable contribution to the ongoing "Satellite Data Quality Assessment" within the SPARC Water vapour Assessment II (WAVAS II) (http://www.sparc-climate.org/activities/water-vapour/).