
O3-N2O tracer-tracer correlations in the tropics provide unambiguous model diagnostics
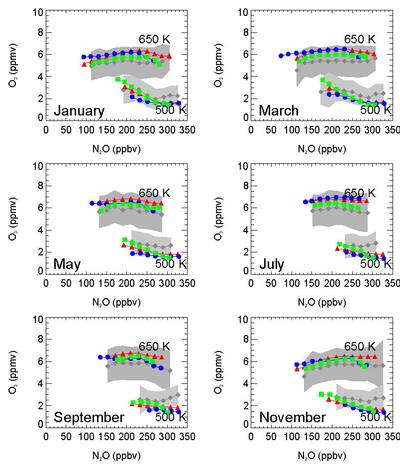
The figure shows the correlation of monthly means of N2O and O3 in the tropics for six different months of the year 2009 at two potential temperature levels (500 and 650 K). The observational data are from the satellite instruments Odin/SMR (grey), Aura/MLS (red), ENVISAT/MIPAS (blue); the green symbols are from the chemistry-climate model WACCM. Although the instruments reveal biases of ozone and N2O with respect to each other, they reproduce the slope of the O3-N2O correlation rather unambiguously, and almost constantly over the year. In contrast, the slope of the O3-N2O correlation from WACCM deviates from the observational data (esp. at the 500K level) and varies with time.
The correlations of O3 and N2O from the satellite instruments ENVISAT/MIPAS, Odin/SMR, ACE-FTS, Aura/MLS, CRISTA-1, and CRISTA-2 at two potential temperature levels in the tropics have been analyzed and compared to O3-N2O correlations from the CCM WACCM, the atmospheric general circulation model ECHAM5/Messy1, and the Karlsruhe Simulation Model of the Middle Atmosphere (KASIMA). The tracer-tracer correlations from observational data demonstrate that the slope of the O3-N2O correlation curve is rather invariant with respect to seasonal and inter-annual variability of the tracers themselves (e.g., due to QBO impact), and instrumental biases. In contrast, deviations of the slopes of the tracer-tracer correlations from the model outputs hint towards model deficiencies. In particular, the differences between model simulations and observations are most likely caused by an underestimation of the quasi-biennial oscillation and tropical upwelling by the models. A realistic consideration of the QBO in the model reduces the differences between model simulation and observations significantly. The intercomparison between Odin/SMR, Aura/MLS, ENVISAT/MIPAS and WACCM shows that these data sets are generally in good agreement, although some known biases of the observational data sets are clearly visible in the monthly averages. Nevertheless, the differences caused by the uncertainties of the satellite data sets are sufficiently small and can be clearly distinguished from model deficiencies. Thus, the method applied in this study is not only a valuable tool for model evaluation, but also for satellite data intercomparisons. For more information, see https://www.atmos-chem-phys.net/13/3619/2013/acp-13-3619-2013.pdf