
Comparisons of broadband radiative transfer calculations with MIPAS spectra
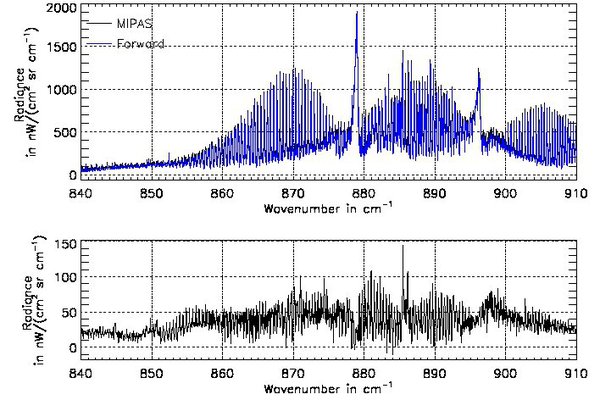
The upper panel of the figure shows mean spectra measured by MIPAS-Envisat (black) and calculated with KOPRA using retrieved trace gas concentrations (blue). The lower panel shows the difference MIPAS minus calculated spectra. HITRAN 2008 spectroscopic data has been used for the calculations. The wavenumber range shown is part of the MIPAS band A and covers the HNO3 emission region. Generally the calculated spectra at the HNO3 signatures are too low compared to the MIPAS measurements, especially at 885.45 and 886.15 cm-1. This means some of the spectroscopic data produces lines with an intensity too low.
Calculations with older spectroscopic data show much more inconsistencies in the HNO3 dataset in this spectral region as well as around 763 cm-1. This shows that HNO3 spectroscopic data has been improved greatly over the last years. This work is a contribution to a special issue of Journal of Quantitative Spectroscopy and Radiative Transfer in honor of Jean-Marie Flaud, Claude Camy-Peyret and Alain Barbe for their achievements in high-resolution molecular spectroscopy. For details see http://www.sciencedirect.com/science/journal/00224073/113/11 (special issue JQSRT) and http://www.sciencedirect.com/science/article/pii/S0022407312000593 (this publication).