
Polluted air trapped in the Asian monsoon anticyclone near the tropopause
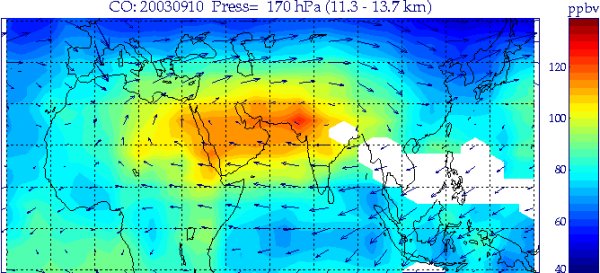
Top: MIPAS observations of carbon monoxide (CO) over Africa, Europe and Asia at 170 hPa for 9-11 September 2003; the arrows indicate the wind field.
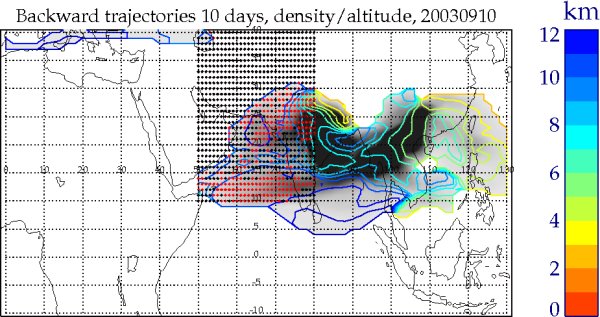
Bottom: 10-day backward trajectories calculated with the HYSPLIT model, ending on 10 September 2003 at 10 km over the area marked by the dotted rectangle. Endpoints of trajectories originating at the boundary layer are represented by red dots. Grey-scale shading indicates density of trajectories, while the colour code indicates their mean altitudes.
MIPAS observations of carbon monoxide (CO) during summer and early fall show a pronounced and persistent maximum in the upper troposphere - lower stratosphere over India and the Arabian Peninsula. The CO enhancement is enclosed by a circulation system called the Asian monsoon anticyclone (see arrows in the top figure). 10-day backward trajectory calculations with the HYSPLIT model indicate that the polluted air masses stem from source regions in South-East China and the Bangladesh Area (red to yellow colours in the bottom panel). They were transported and uplifted in the convective systems of the Asian summer monsoon and finally trapped within the circulation system of the Asian monsoon anticyclone. Since biomass burning activity was low in the source regions during beginning of September, industrial and urban emissions are the most likely sources of pollution.
For further details see http://www.atmos-chem-phys.net/9/2387/2009/acp-9-2387-2009.html