
The SPARC water vapour assessment II: Biases and drifts of water vapour satellite data records with respect to frost point hygrometer records
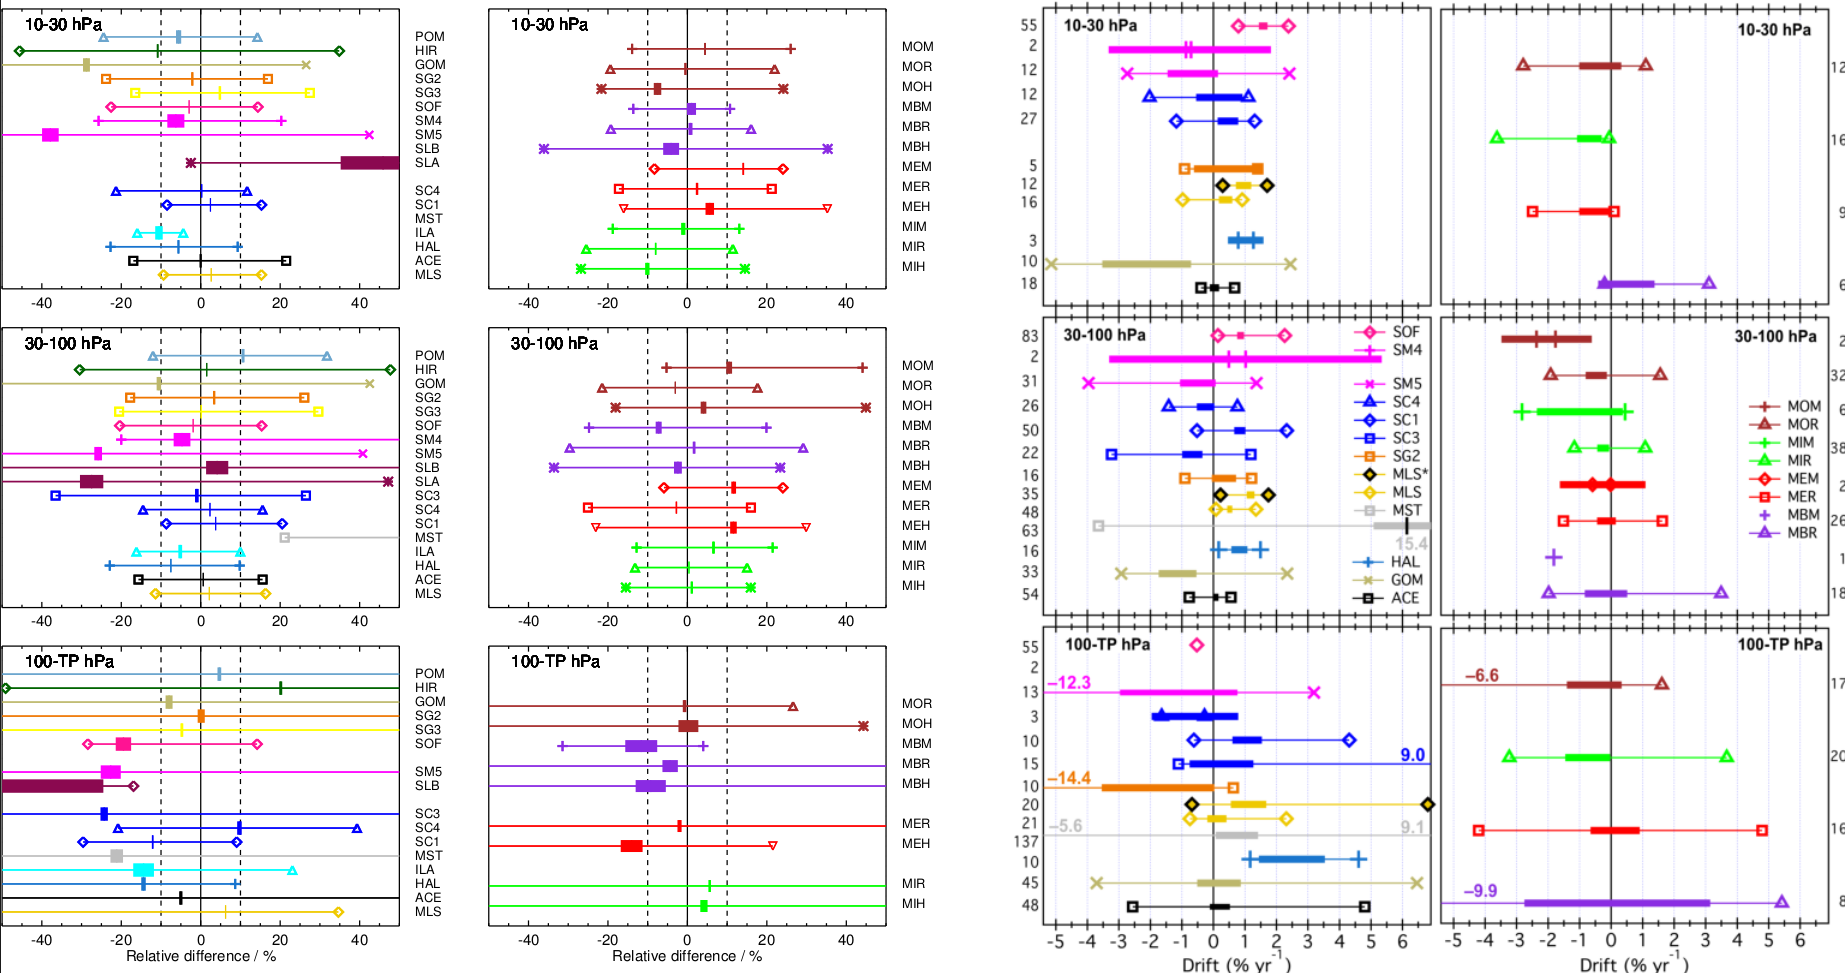
Left two columns: Relative differences of satellite and FP data averaged over all sites and the three pressure ranges 10-30 hPa (top row), 30-100 hPa (middle row), and 100 hPa to tropopause (bottom row). The panels on the left show comparisons for all satellite instruments except MIPAS. In the right column all MIPAS comparisons are displayed. For color coding and symbols please refer to the preprint. Thin lines between symbols span the 5-95 % range of the data, while thick bars indicate the range of twice the standard errors around the mean biases. Average biases are given by the center of the thick bars. Leftmost column: all satellite data sets without MIPAS; second column: only MIPAS data sets. Right two columns: Drift statistics for each satellite data set across all paired FP sites. Mean drifts are the values at the left-to-right centers of the 95 % confidence intervals (thick horizontal bars). Markers connected by thin horizontal lines show the 5th and 95th percentiles of the drifts for each SAT. Values presented to the left of the left panels and to the right of right panels indicate the number of retrieval levels with difference time series that were used to determine the statistics shown. Third and rightmost column plot panels are for non-MIPAS and MIPAS data sets, respectively. Details can be found here.
In the frame of the second SPARC water vapour assessment (SPARC WAVAS II), biases and drifts and their uncertainties between the stratospheric water vapor measurement records of 15 satellite-based instruments (31 different retrieval data sets) and balloon-borne frost point hygrometers launched at 27 globally distributed stations, were quantified. These comparisons of measurements during the period 2000-2016 are made using robust, consistent statistical methods. With some exceptions, the biases and drifts determined for most satellite/hygrometer pairs are < 10 % and < 1 %/yr, respectively. A thorough presentation of data sets, methods, and results is accepted for publication in AMT and available as preprint.