
MIPAS data contribute to the validation of assimilated MLS trace gas distributions
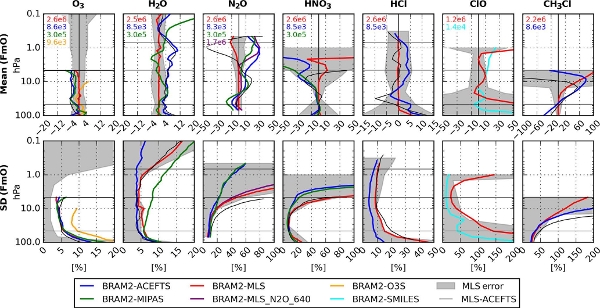
The assimilation software BASCOE was used to reanalyze MLS trace gas measurements. Assimilated fields were compared to independent measurements, including MIPAS. The plots show vertical profiles of the mean diffrerences (top row) and the standard deviations of the differences (bottom row). Green lines refer to MIPAS. The numbers in the top left corner of the mean difference plots are the numbers of measurements evaluated, in the same color coding as the vertical profiles. Grey shaded areas are the accuracy and the precision, respectively, of the MLS measurements.
For ozone and HNO3 the mean differences are fully explained by the MLS precision estimates alone. Water vapor differences are larger. The characterization of water vapour profiles from different satellites is currently assessed in the SPARC Activity WAVAS-II. Also N2O mean differences (assimilation minus MIPAS) exceed the MLS accuracy estimates, but MIPAS seems to agree quite well with ACE-FTS.
For further details, see https://doi.org/10.5194/acp-19-13647-2019