
Estimated ozone trends depend on the analysis method
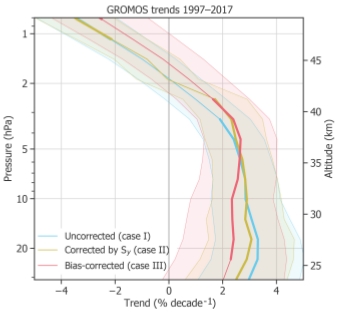
Vertical profiles of ozone trends over Berne, measured with the GROMOS microwave radiometer. The profile plotted in blue represents the trend obtained with a direct analysis of the data. The brown curve shows trends based on an analysis where within the trend fit, a reduced weight was assigned to anomalies. Trends where an unknown bias between data subsets was considered by a fully correlated block in the data error covariance matrix are plotted in red. A trend analysis tool was used that was developed at IMK and which supports the use of the full data error covariance matrix. These investigations were recently published by Leonie Bernet and colleagues in ACP.
Often biased time series still contain useful information on trends. It is thus not adequate to assign to the biased data a lower weight during the trend fit. However, if the biased data are not temporally equally distributed over the analysis window, they can distort the analysis. A bias correction is often not possible because the bias is not always known. The inclusion of a fully correlated block in the data covariance matrix makes the trend fit insensitive to the bias. The mathematics behind this method is described in Clarmann et al., 2010.
For more information see: https://www.atmos-chem-phys.net/19/4289/2019/