
Upper tropospheric PAN distributions derived from MIPAS used for the first time within tropospheric transport studies under North Atlantic Oscillation (NAO) impact
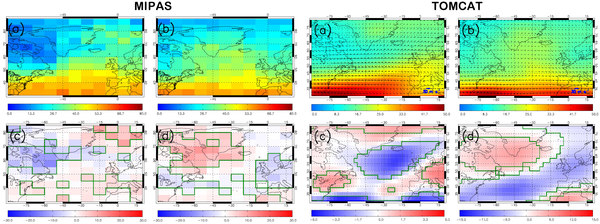
The left figure shows the distribution of PAN from MIPAS, averaged between 200 and 100 hPa for 2002 - 2012, for different NAO phases (top), and the phase anomalies relative to the all wintertime (NDJF) average (bottom); left panels are wintertime averages for NAO+ phases, right panels for NAO-phases. The right figure is the same for TOMCAT CTM simulations for the years 2006 - 2015, including horizontal winds (arrows). While the absolute distributions (except for a bias) from TOMCAT and MIPAS agree very well, the differences to the wintertime mean differ which can be related to the different periods sampled.
Few studies have directly used satellite measurements of composition to investigate the influence of the NAO on UTLS trace-gas distributions. This is the first study to use UTLS PAN, retrieved from MIPAS at KIT, which has a lifetime of several months, to investigate vertical transport of polluted tropospheric air masses into the UTLS under different NAO conditions. The North Atlantic Oscillation Index (NAOI) is defined as “the normalised pressure at the southern location (i.e. Gibraltar) minus the normalised pressure at the Icelandic site (i.e. Reykjavik)”.
The MIPAS PAN 200–100 hPa average volume mixing ratio, sampled under NAO-high (for the months NDJF) between 2002 and 2012, shows peak PAN concentrations of 50–55 (10–20) pptv in the subtropical North Atlantic. Peak significant anomalies of 5–15 pptv occur over the sub-tropical Atlantic and north-eastern Arctic region (top right of the domain). Under the positive phase of the NAO (NAO-high), strong westerlies tend to enhance transport of European pollution away from anthropogenic source regions. There are also significant negative anomalies (−15 to −5 pptv) over the Québec region.
PAN in the UTLS peaks over Iceland and southern Greenland in NAO-low, between 200 and 100 hPa, consistent with the trapping by an anticyclone at this altitude. Over Iceland and Greenland (subtropical North Atlantic and Europe), there are positive (negative) anomalies of 5–15 (−5 to−1) pptv in NAO-low. Model simulations show that enhanced PAN over Iceland and southern Greenland in NAO-low is associated with vertical transport of polluted air from the mid-troposphere into the UTLS.
Overall, the use of recent satellite data sets, not used in context of the NAO before, and a model simulation have quantified the recent influences of the NAO on tropospheric composition and co-variability between pollutants.
For more information see: https://doi.org/10.5194/acp-18-8389-2018