
Subsidence during a major stratospheric warming observed and modelled
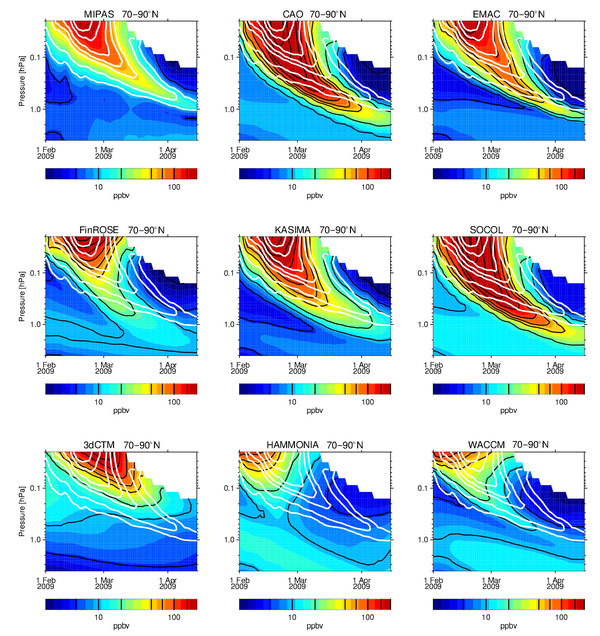
The figure shows the timeseries of mean NOx (= NO + NO2) averaged over 70-90o N during the strong major warming/elevated stratopause event in late winter 2009. The observations by MIPAS (top left panel) are compared to simulations from 8 different models. The white lines in the model results are the isolines from the MIPAS panel.
The models are either constrained by observed NOx at the model top (like e.g. EMAC), or they reach up into the lower thermosphere (like e.g. WACCM) and produce their own mesospheric-lower thermospheric NOx. Nudging to re-analyses is done in various ways, but mainly restricted to the troposphere and middle to upper stratosphere. Models in the upper two rows show in general too much, too fast, and too deep subsidence compared to the observations. For the three models in the lowest row, the subsidence is either not deep enough or it is too weak. The amount of NOx at the upper boundary of the analysis region differs also considerably.