
MIPAS nitrous oxide profiles validated
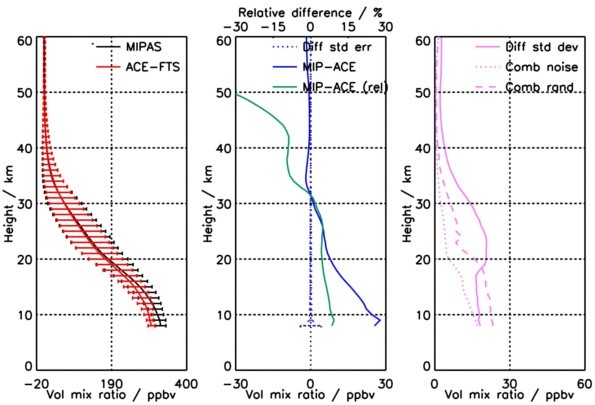
The figure shows the comparison of N2O from ACE-FTS and MIPAS reduced resolution (V5R_N2O_225 and V5R_N2O_224). Left panel: Mean profiles of MIPAS (black) and its standard deviation (horizontal bars) and of ACE-FTS (red) and its standard deviation (horizontal bars). Middle panel: Mean difference MIPAS minus ACE-FTS (blue solid), standard error of the difference (blue dotted), mean relative difference MIPAS minus ACE-FTS relative to ACE-FTS (green, upper axis). Right panel: combined mean estimated statistical error of the difference (pink dotted, contains MIPAS instrument noise error only), combined mean estimated statistical error of the difference (pink dashed, contains MIPAS example random error budget), standard deviation of the difference (pink solid).
To validate N2O profiles retrieved from MIPAS spectra with our new setup, we made comparisons based on collocated profiles with satellite measurements from ACE-FTS, Aura-MLS and Odin-SMR. Below 25 km, we find a positive bias for MIPAS. The differences are in the range of 0 to 30 ppbv. The largest differences occur at altitudes below 10 km. From 30 km upwards, the MIPAS profiles show lower values than the other instruments. The same is the case above 40 km for ACE-FTS and Odin-SMR. However values measured by Aura-MLS are lower than the MIPAS values above 40 km. Additionally we discuss comparisons to surface data and the consistency of the data from the different MIPAS measurement periods.
Further details can be found here: http://www.atmos-meas-tech.net/9/765/2016/