
Reassessment of MIPAS age of air trends
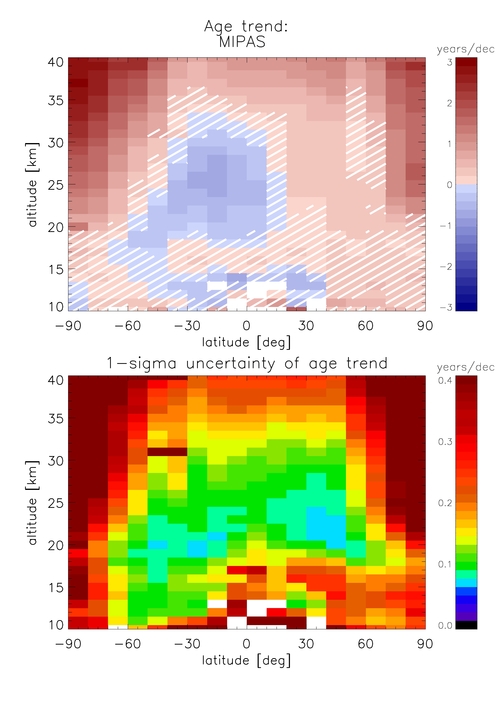
Altitude-latitude cross-section of new MIPAS age of air trends derived from SF6-measurements over the years 2002 to 2012 (Top panel). Red areas represent regions where trends are positive while blue areas represent regions where trends are negative. Hatched areas indicate where the trend is not significant, i.e. it is smaller (in absolute terms) than its 2-sigma uncertainty. In the bottom panel the 1-sigma uncertainty of the derived age of air trends are shown.
The setup of the MIPAS SF6 retrieval has been improved and a newly calibrated version of MIPAS-ENVISAT level 1b spectra (version 5, ESA data version 5.02/5.06) was used to obtain a new global SF6-data set, covering the total observational period of MIPAS from July 2002 to April 2012 for the first time. The SF6-profiles were averaged monthly and zonally and converted into mean age of air using a tropospheric SF6-reference curve. The new age of air data set was analyzed in its temporal evolution by fitting a regression model consisting of a linear trend term, two proxies for the quasi-biennial oscillation variation and some sinusoidal terms for seasonal variations and overtones to the age of air time series in 10º latitude and 1-2 km altitude bins. The linear term represents the age of air trend over the total MIPAS period in each bin and is shown as a global view in the figure (top panel) above. Compared to previous findings this new pattern of age of air trends appears to be less patchy and more coherent.
Further details can be found here: http://www.atmos-chem-phys.net/15/13161/2015/