
A solar signal in stratospheric water vapour
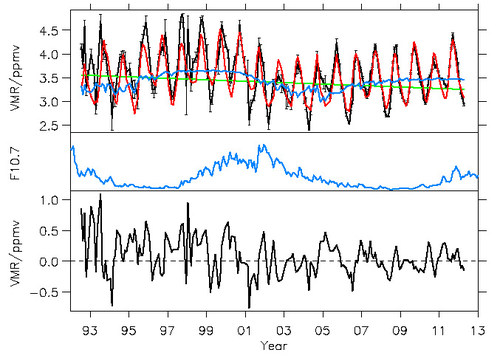
This figure shows a water vapour time series built from homogenized tropical MIPAS and HALOE measurements at 17 km altitude (upper panel, black) along with a multi-linear model fit (red). The solar component is plotted in blue, and the linear trend term in green. The solar radio flux index (F10.7 index) as a proxy for the solar impact is plotted in blue in the middle panel. The black curve in the lower panel is the residual between the measured data and the multi-linear fit. The residual could be largely reduced by inclusion of the solar term.
The phase shift of the solar signal increases with the distance from the stratospheric entry point, suggesting that the solar signal is imprinted there. Lowest water vapour mixing ratios are seen about 2 years after the solar maximum at the entry point, and delayed by typical stratospheric transport times for more distant locations. Consideration of the solar term leads to a negative water vapour trend, which is in better agreement with decreasing tropopause temperatures than the positive trend one would obtain without consideration of the solar term.
For further details, see: http://www.atmos-chem-phys.net/15/9851/2015/acp-15-9851-2015.html