
Arctic winter 2010/2011 at the brink of an ozone hole
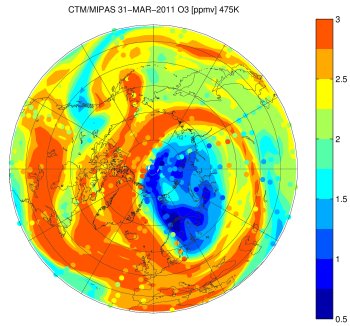
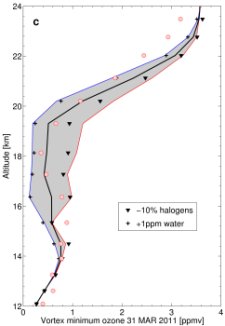
The left figure shows the Arctic "ozone hole" at 475 K (about 19 km) on March 31, 2011 as seen by MIPAS (colored circles) and simulated by a chemistry transport model (contours). The model captures excellently the amount of the ozone loss and its spatial distribution. Ozone volume mixing ratios as low as 0.5 ppmv are observed. The right figure compares vertically resolved observed minimum ozone on March 31, 2011 with model assessments. Minimum ozone concentrations of 0.3 ppmv are seen around 18 km (red dots), again in excellent agreement with the model mixing ratios (solid black line). The red and blue lines show the simulated minimum ozone for temperatures 1 K higher and lower, respectively. The triangles and crosses show simulated minimum ozone for a stratospheric halogen load reduced by 10%, and stratospheric water increased by 1 ppmv, respectively. Reduction of the stratospheric halogen load can counterbalance lower temperatures, while increased water vapor has the same effect as lower temperatures. In summary, in a future Arctic stratosphere with lower temperatures, increased water vapor but reduced halogens as expected for the next 20 years almost complete ozone loss is not improbable.
The Arctic stratospheric winter of 2010/2011 was one of the coldest on record with a large loss of stratospheric ozone. Observations of temperature, ozone, nitric acid, water vapor, nitrous oxide, chlorine nitrate and chlorine monoxide from the Michelson Interferometer for Passive Atmospheric Sounding (MIPAS) onboard ENVISAT have been compared to calculations with a chemical transport model (CTM). There is overall excellent agreement between the model calculations and MIPAS observations, indicating that the processes of denitrification, chlorine activation and catalytic ozone depletion are sufficiently well represented. Polar vortex integrated ozone loss reaches 120 Dobson Units (DU) by early April 2011. Sensitivity calculations with the CTM give an additional ozone loss of about 25 DU at the end of the winter for a further cooling of the stratosphere by 1 K, showing locally near-complete ozone depletion (remaining ozone <200 ppbv) over a large vertical extent from 16 to 19 km altitude. In the CTM a 1 K cooling approximately counteracts a 10% reduction in stratospheric halogen loading, a halogen reduction that is expected to occur in about 13 years from now. These results indicate that severe ozone depletion like in 2010/2011 or even worse could appear for cold Arctic winters over the next decades if the observed tendency for cold Arctic winters to become colder continues into the future. For further details see:
http://www.kit.edu/visit/pi_2012_8751.php