
Circulation changes explain the vertical structure of stratospheric water vapour changes
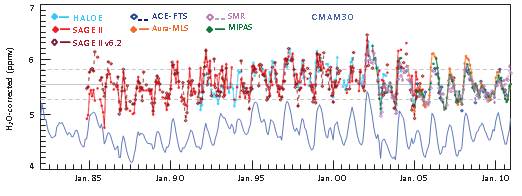
Measurements of stratospheric water vapour from various satellite instruments were merged into a long-term time series using a model simulation as transfer standard. The figure (from Nature Geoscience 7, 768–776, 2014, doi:10.1038/ngeo2236) shows the development of the volume mixing ratio of water vapour at 10 hPa, 40° N, as simulated by CMAM30 (blue) and measured by various satellite instruments. While the stratospheric water vapour content is largely driven by the tropopause temperature, the vertical structure of the trends is explained by stratospheric circulation changes which controls the gain of water vapour from methane oxidation.
Combined analysis of water vapour and methane, along with the assumption of [H2O]+2[CH4] being conserved allow to infer the time lag between the measurement and the air parcels entry into the stratosphere. Differences between the altitude-latitude distribution of the trends of the so-called age of air determined by this method and distributions found in the literature still need to be investigated.
For more details, see http://www.nature.com/ngeo/journal/v7/n10/pdf/ngeo2236.pdf